CHOOSING SCRIPTING AND DEBUGGING ENGINE FOR YOUR .NET APPLICATIONS
At AlterNET Software, we have been focusing on developing several scripting and debugging engines that enable user-written code to be executed and debugged in various programming languages.
The main objective of these engines is to provide .NET developers with the tools that would allow users of their applications to write their scripts, which can extend the application logic. A good example of such usage is Visual Basic for Applications, where users can write macros that automate some tasks with Microsoft Word or Excel documents.
Below I would like to outline the scripting engines we have developed and their pros and cons.
C# and Visual Basic script execution and debugging
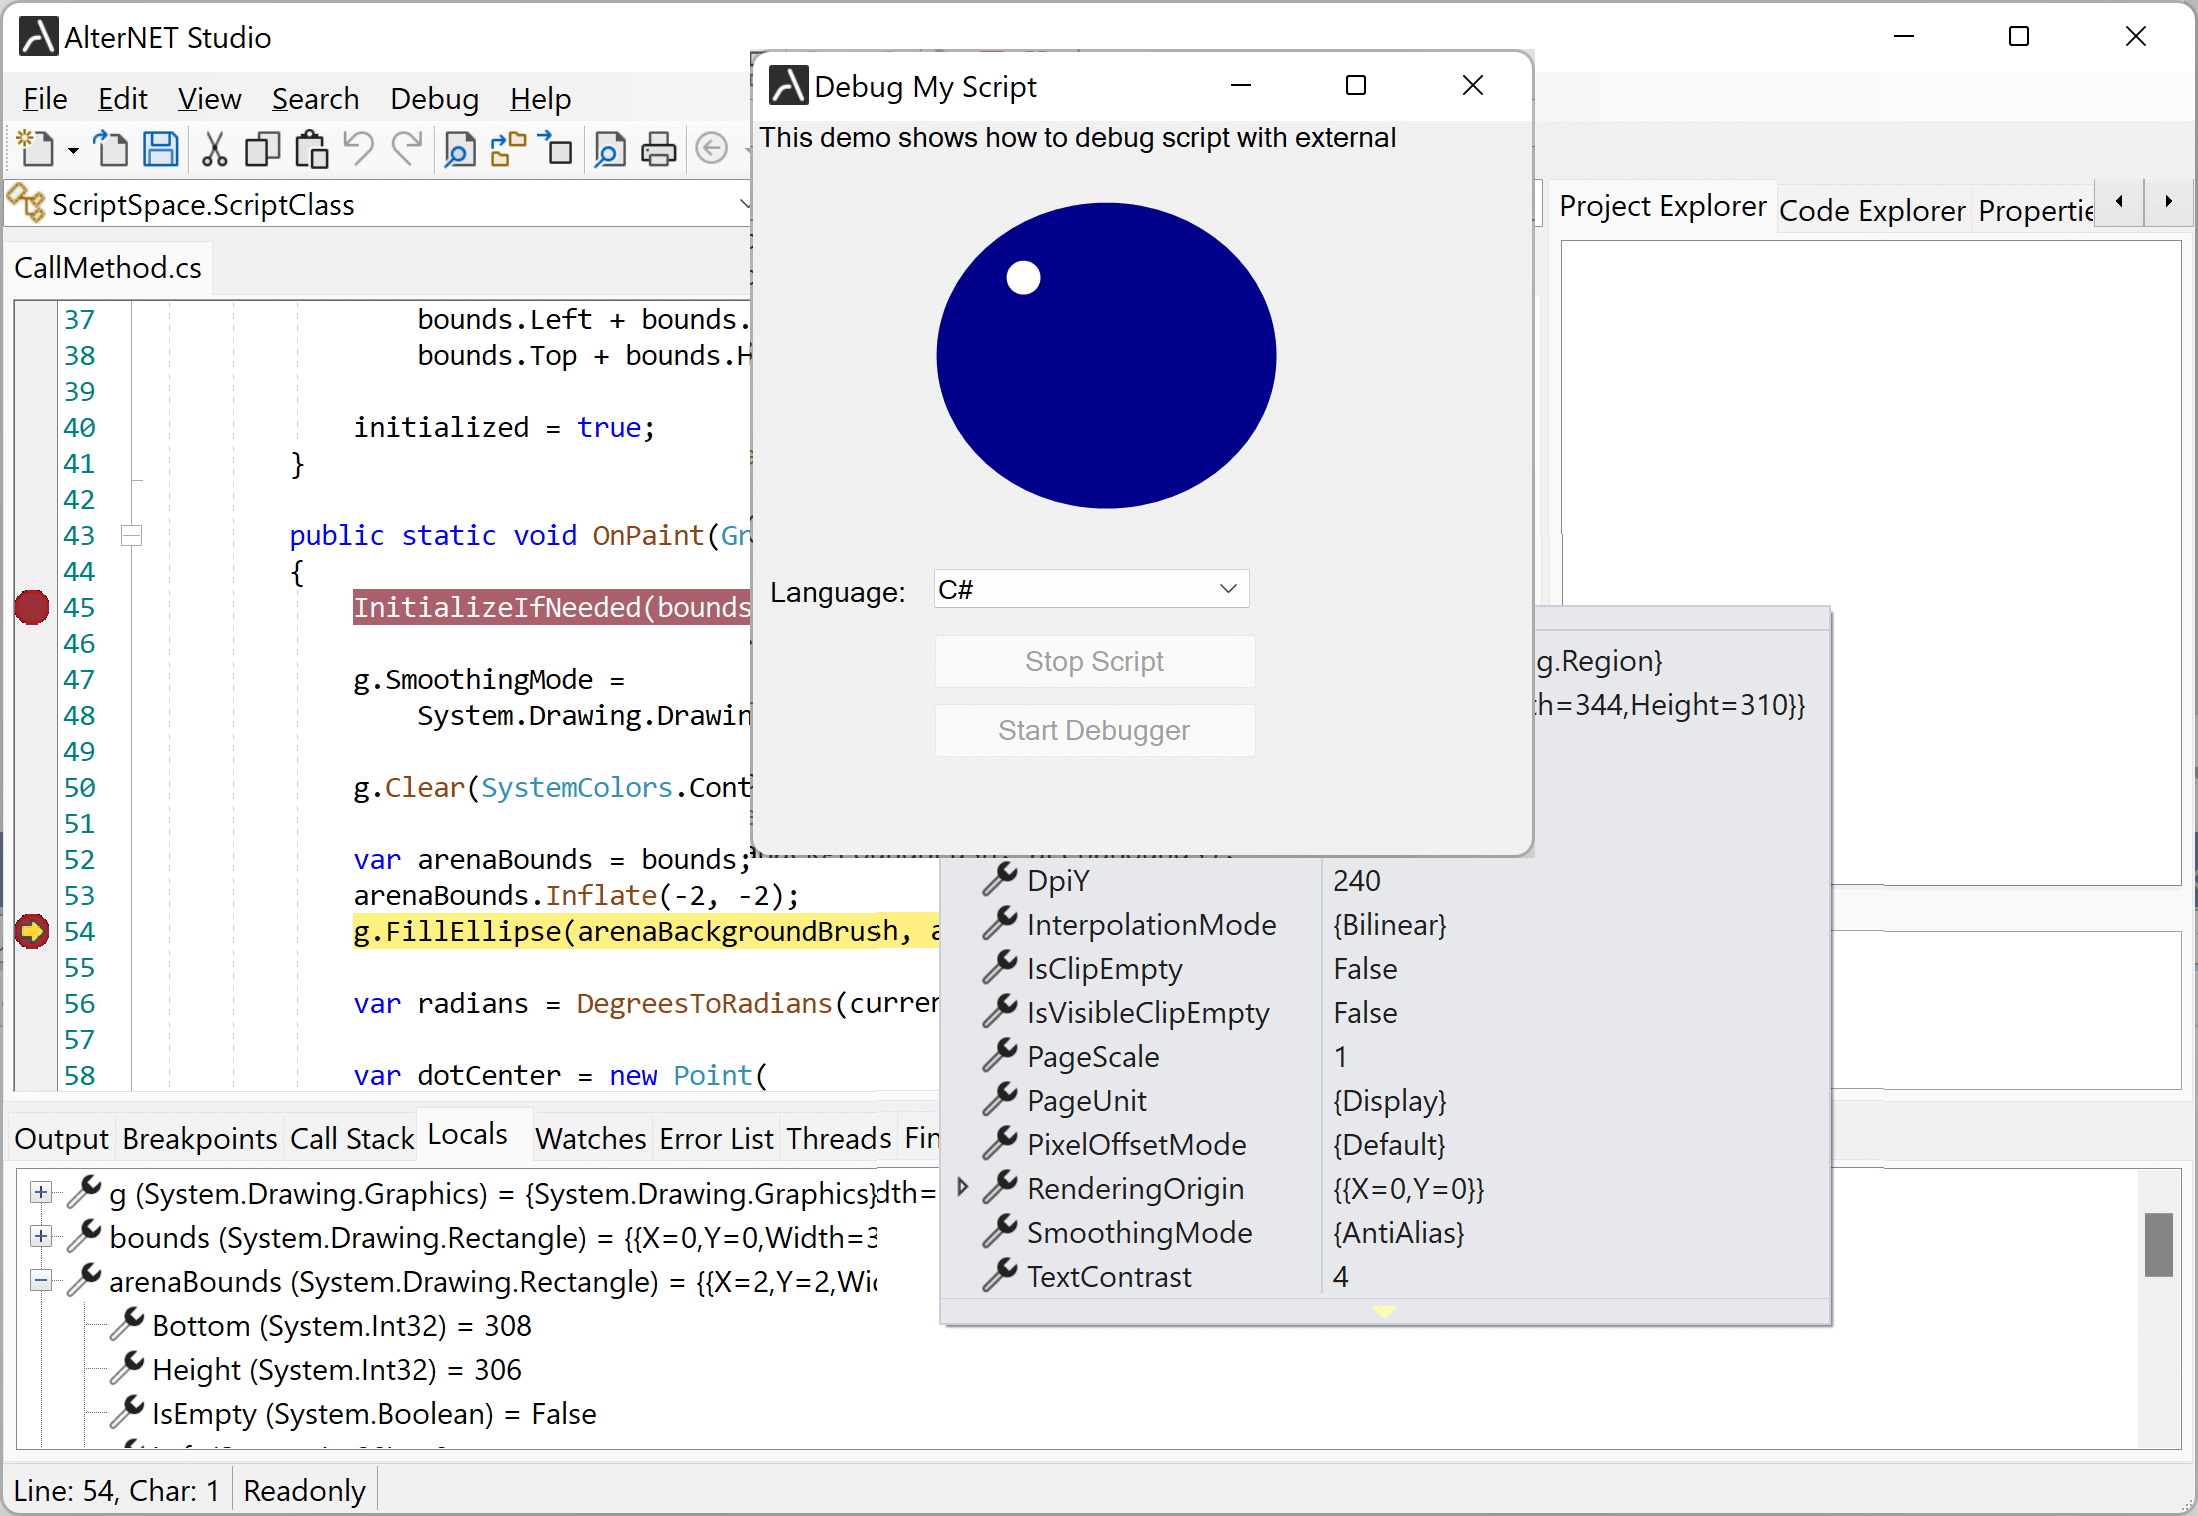
It is our first scripting engine that can be incorporated into your own .NET application, allowing users to write scripts in C# or Visual Basic and run them within it. Initially, scripting for C# and Visual Basic was implemented using CodeDOM technology, later undergoing an upgrade and relying instead on the modern Microsoft Code Analysis APIs (Roslyn). These APIs are also used in our Code Editor for C# and Visual Basic programming languages and provide a code-writing experience similar to the Visual Studio text editor. You can read more about code editing here.
AlterNET script debugger for C# and Visual Basic is based on the NET Framework Command-Line Debugger (mdbg), built on ICorDebug interfaces. These interfaces are included in the .NET Framework and used internally by the Visual Studio debugger. This debugger provides all essential debugging features, like executing code line-by-line, breakpoints, expression evaluation, etc.
However, the compiled scripts are eventually converted into machine instructions, which imposes a hard limitation on running and debugging scripts in the same application process. Therefore, either script debugging logic needs to be implemented in a separate application, or the script itself needs to be compiled into a separate executable. The latter scenario may involve inter-process communication techniques for scripts to access application-defined objects. You may read more about these limitations here.
Python and IronPython scripting and debugging
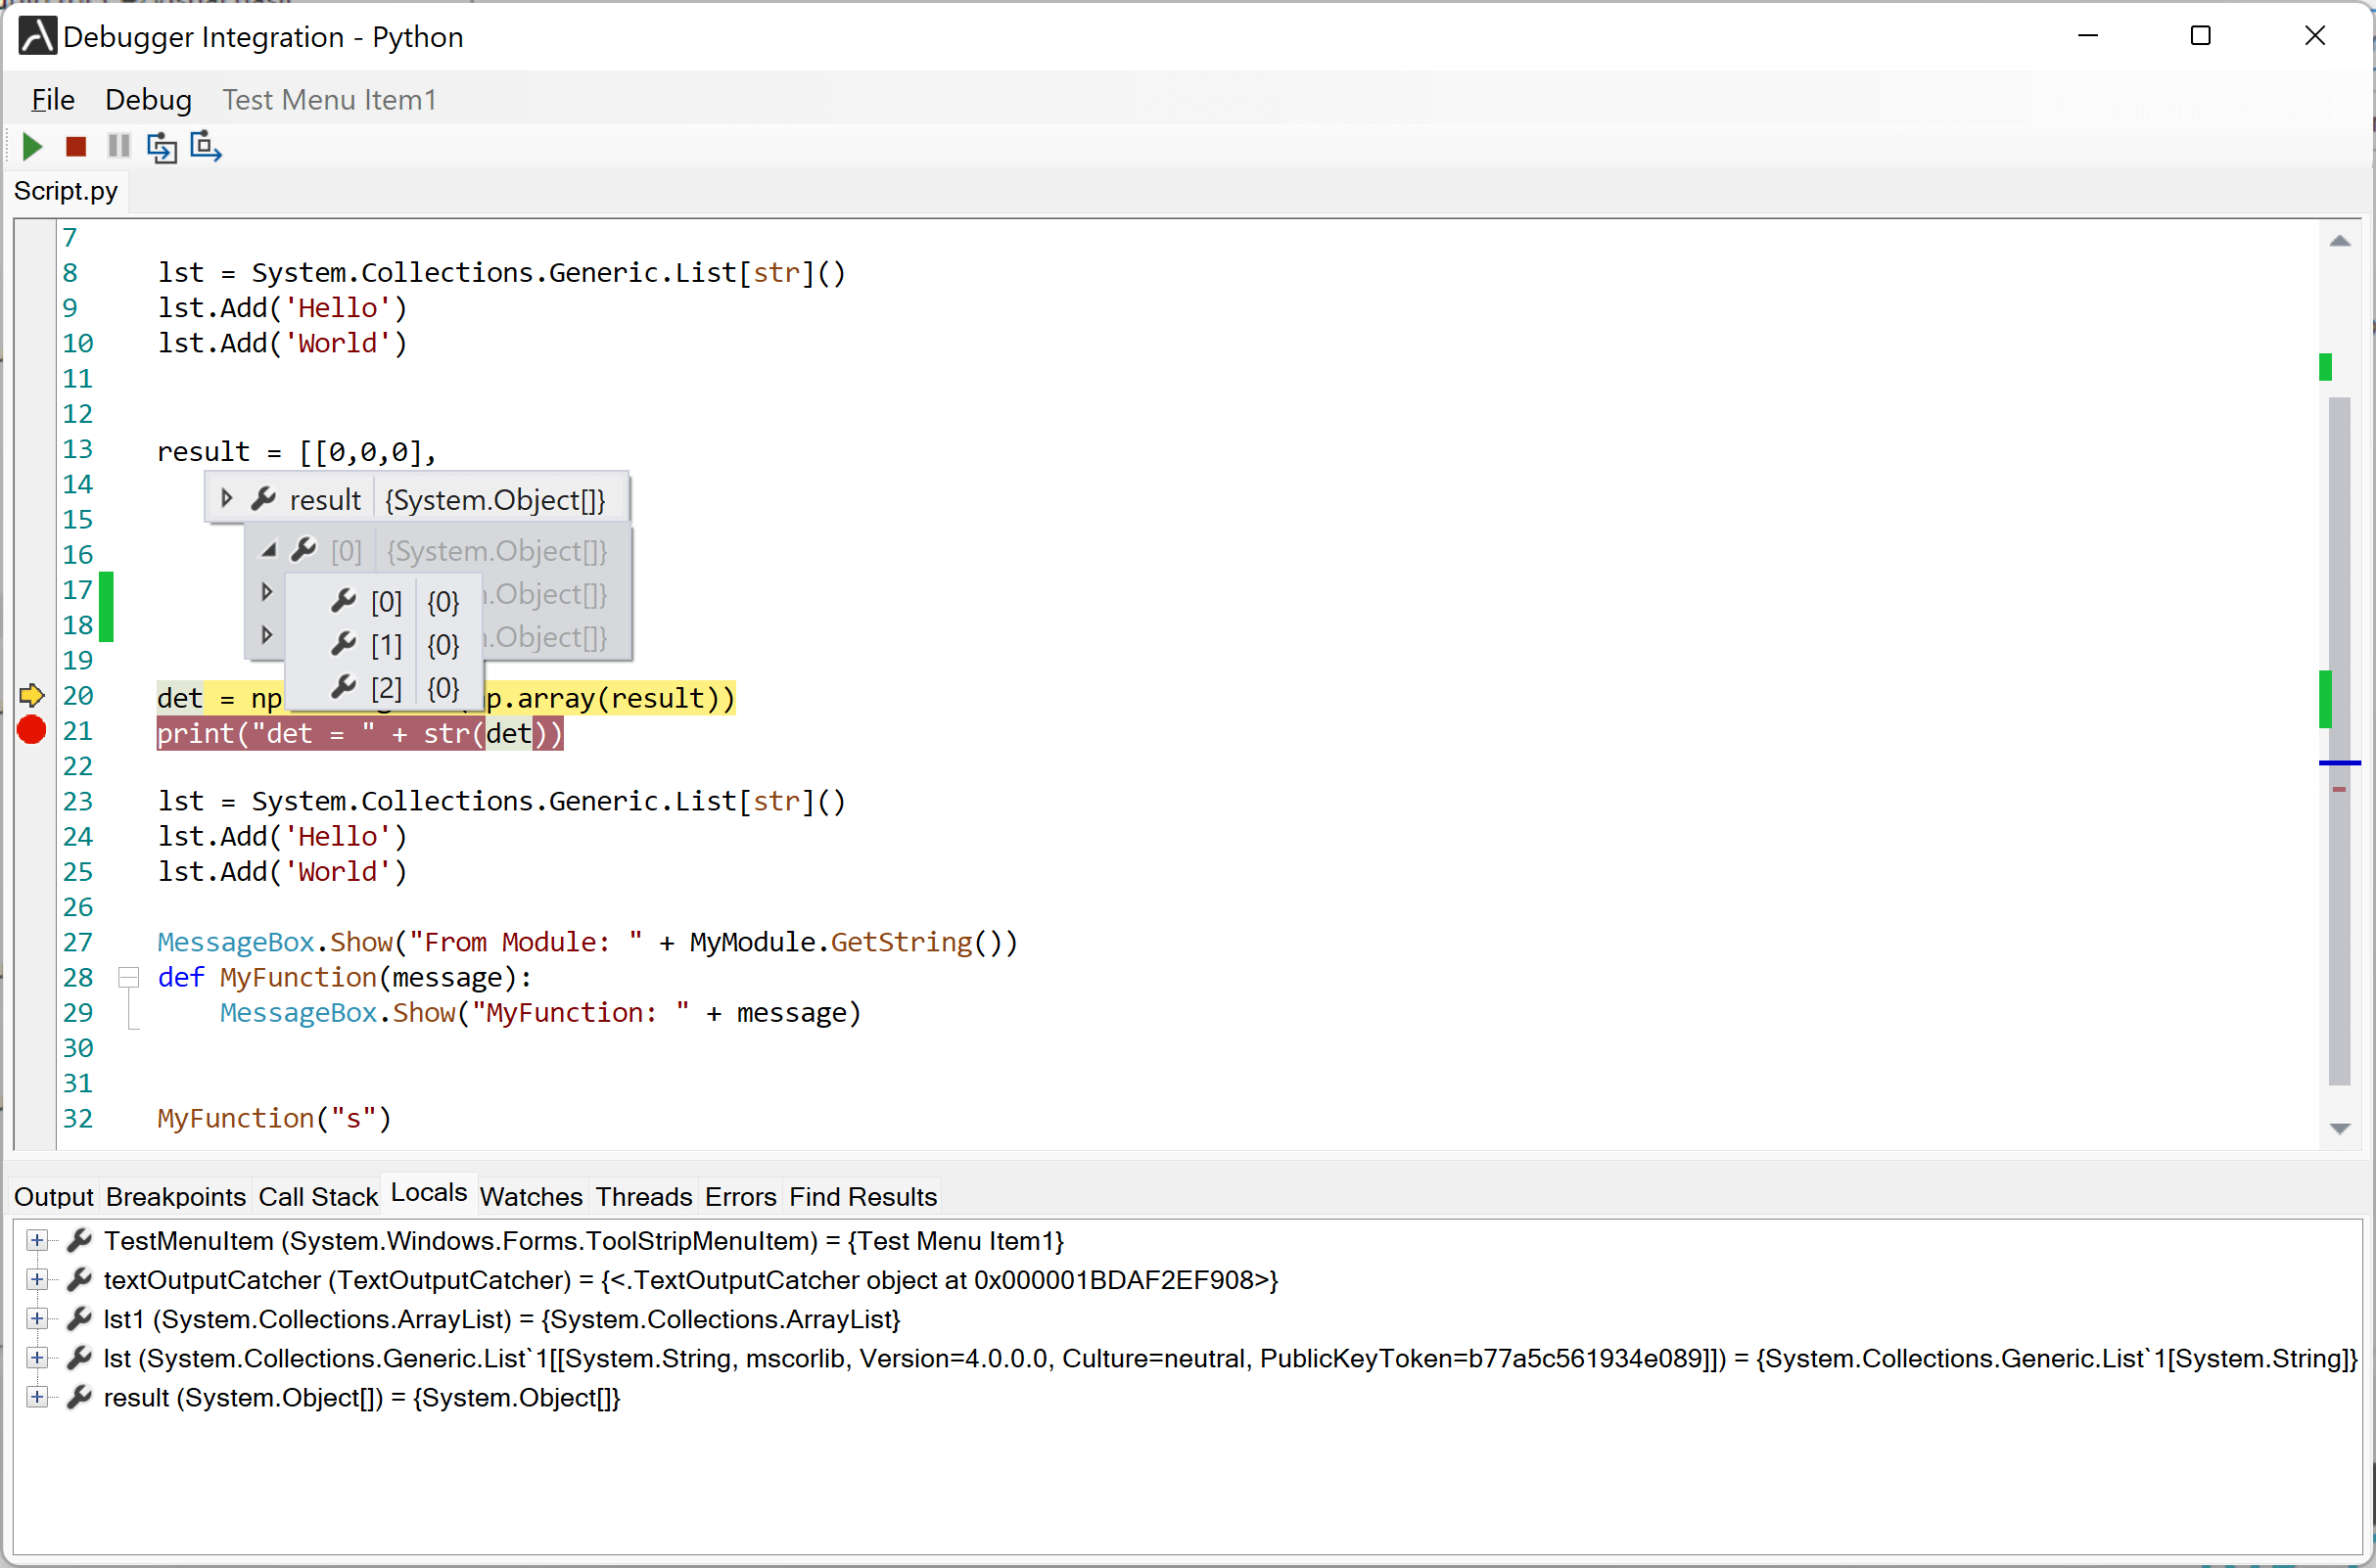
We explained these scripting and debugging engines in detail in this blog post; in a nutshell, we provide two separate implementations, one for IronPython, a Microsoft implementation of the Python language, and Python.NET, a package that gives Python programmers nearly seamless integration with the .NET. The latter requires Python or embedded Python to be installed on the target computer and lacks multithreading capabilities; however, it provides access to numerous third-party libraries, such as Pandas or NumPy, which include modules written in languages like C/C++.
Regarding script debugging, Python and IronPython script debuggers provide an almost identical set of features as the C#/Visual Basic debugger. They do not have limitations related to the execution of native code: Python and IronPython script execution and debugging can seamlessly integrate into the same application.
As for script writing, neither of these engines includes code editing APIs, so we have implemented our proprietary parser for Python/IronPython, which provides most of the advanced code editing features, such as code completion, code outlining, etc.
TypeScript and JavaScript scripting and debugging
We featured these engines in our blog post; the TypeScript/JavaScript scripting is implemented with Microsoft ClearScript, and Script Debugger uses Google Chrome Debugger development tools.
A lot happens beneath the surface when you run TypeScript code for the first time, such as generating type definition files for all .NET assemblies referenced in the scripts and converting TypeScript to pure JavaScript code. It might be a bit slow when you execute it for the first time.
TypeScript debugger provides a rich set of debugging capabilities, similar to C# and Python debuggers; however, it lacks multithreading capabilities.
On top of scripting, Microsoft TypeScript includes industrial-grade APIs for code editing, which are fully utilized in our TypeScript parser and provide a code writing experience similar to editing typescript code in the Visual Studio Code text editor.

Script debugging using DAP (Debug Adapter Protocol)
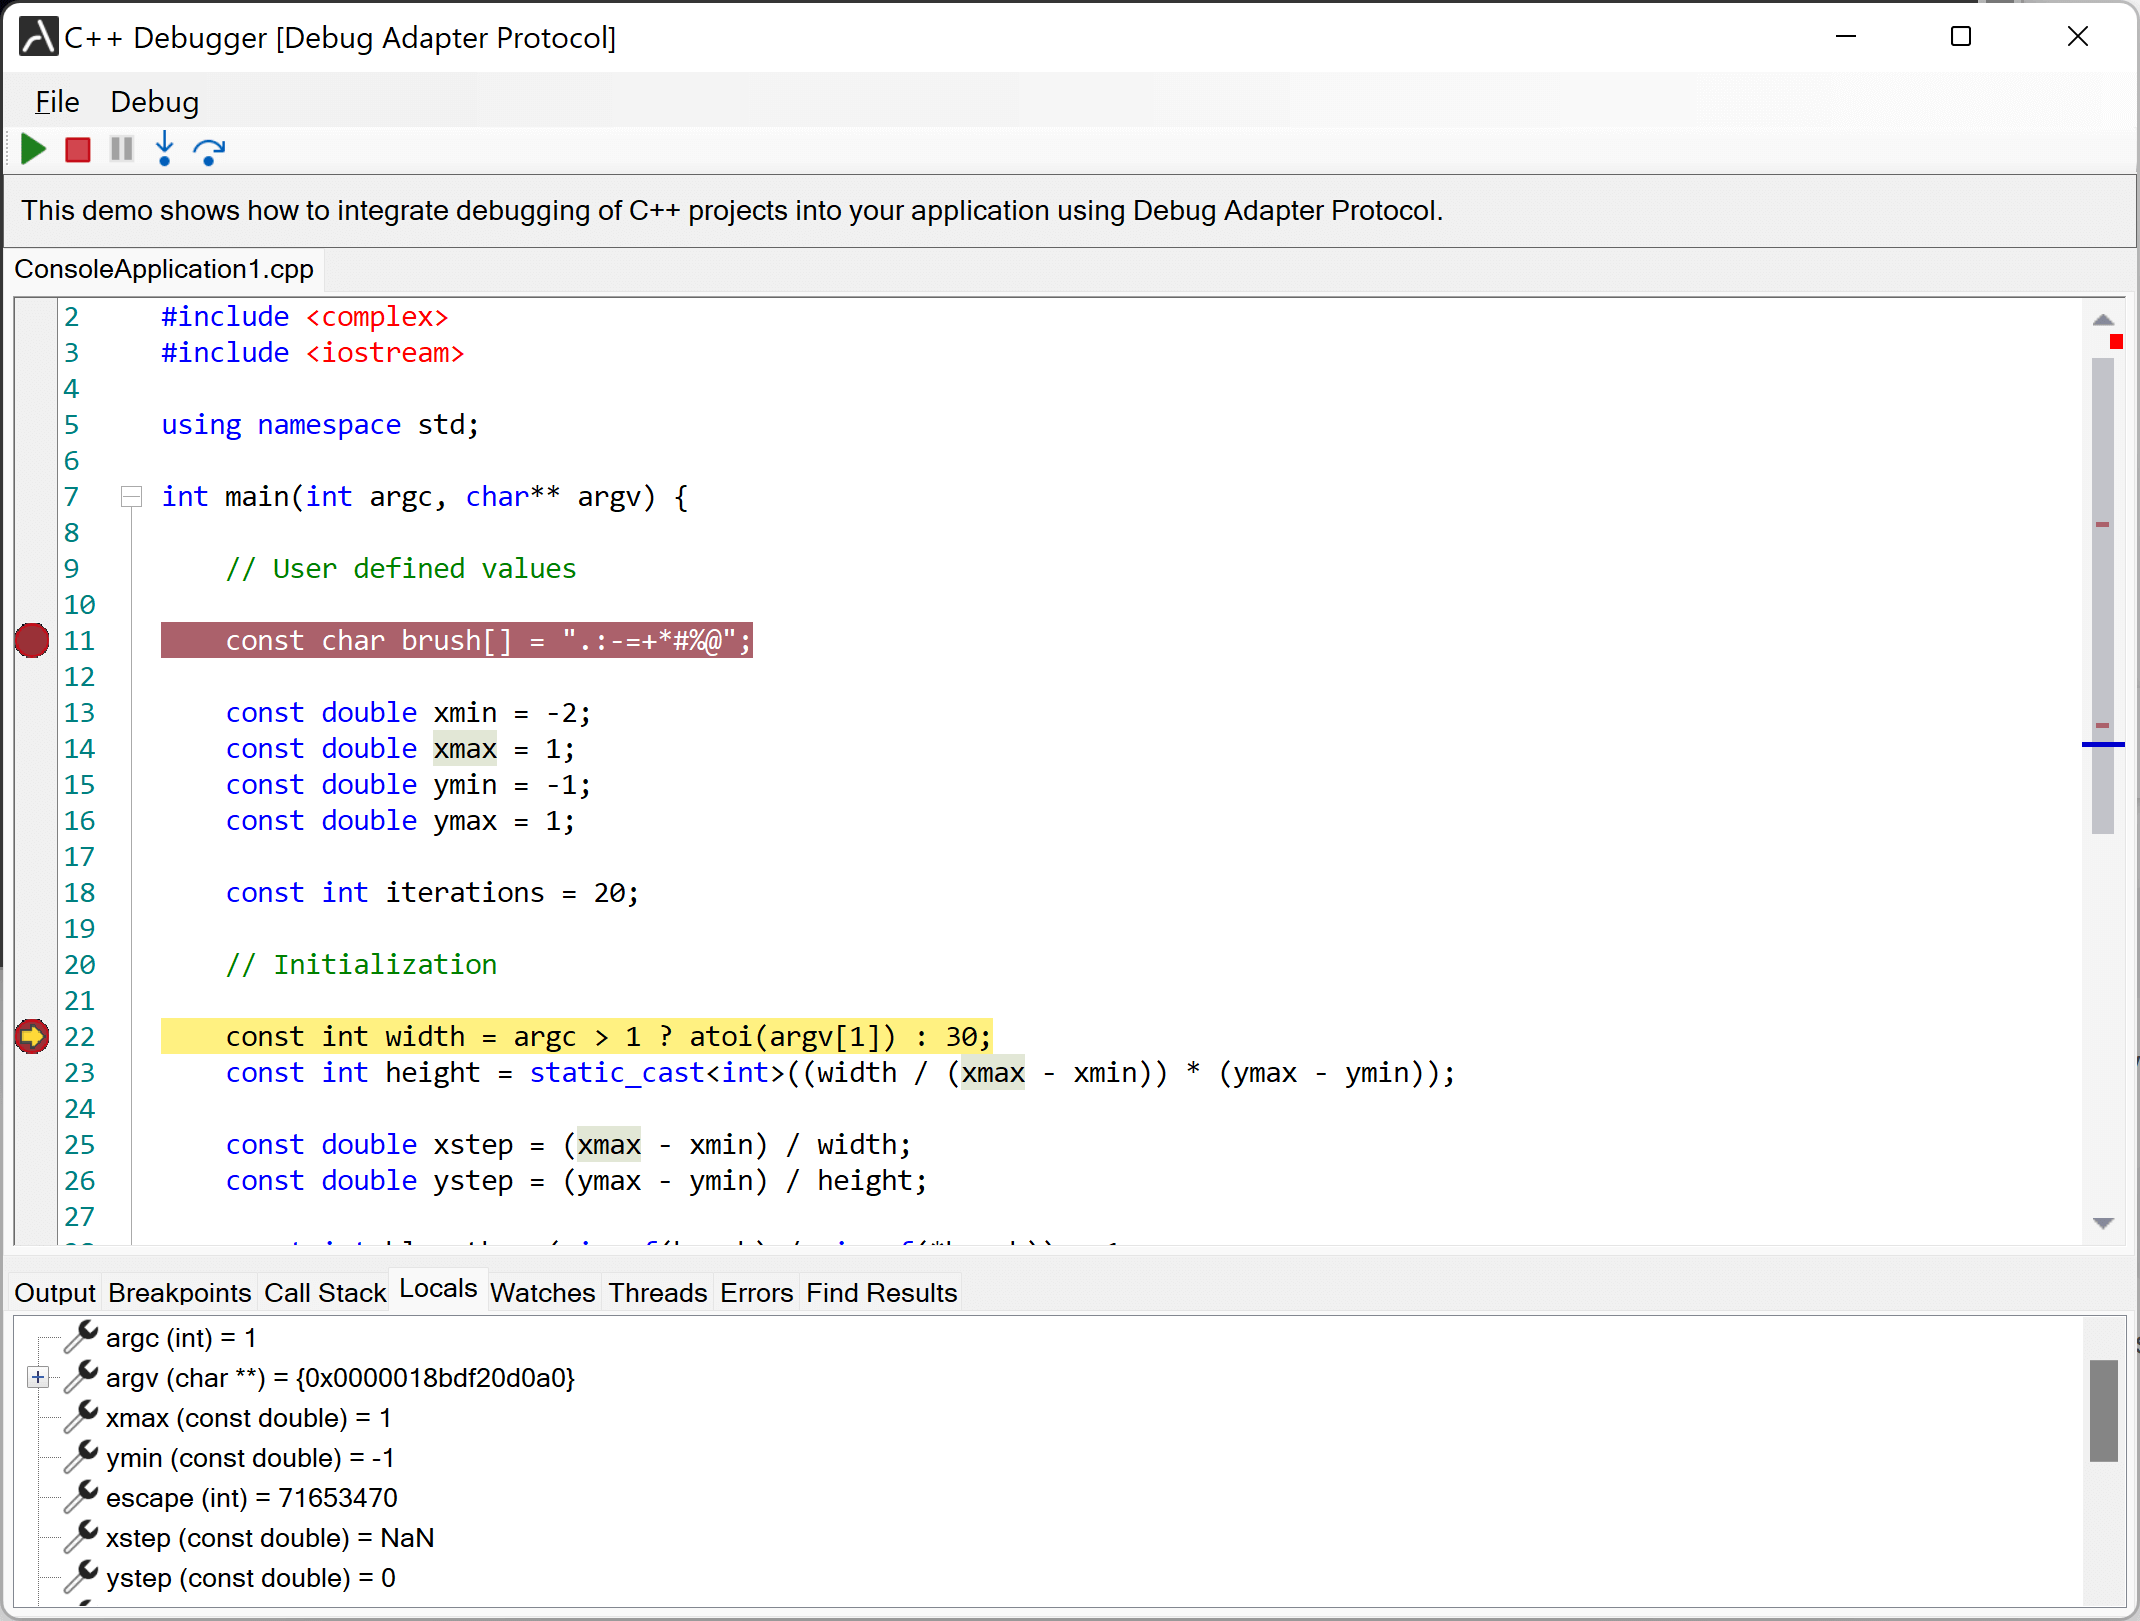
We wrote a bit about this technology here; the Debug Adapter Protocol makes it possible to implement a generic debugger for a development tool that can communicate with different debuggers via Debug Adapters. Native tools that implement these protocols must be installed on the target computer. We have implemented several Debug Adapters for various programming languages, including Python, C/C++, Java, Lua, and others.
Unlike other scripting engines, this one relies on external tools to provide script debugging and is not intended to run or debug in-application scripts. Instead, developers can use it for creating integrated development environments like applications similar to Microsoft Visual Studio, Eclipse, and other IDEs.
As for code editing, our Language Server protocol parsers can be used with DAP script debugging engines to provide code writing features like auto complete, go to definition, finding references, and so on.
When writing this blog, we implemented debugging for C++ and Python.
What’s on our road map
Right now, accessing application objects (such as getting properties of visual controls) needs to be done in a thread-safe way for Python/IronPython scripts in debug mode, and TypeScript does not support it at all. In the future, we’re looking at implementing our debug message loop, which would eliminate some of the limitations related to accessing the UI thread from the debugged script. We also want to extend our DAP engines with other languages, such as PowerShell.